Mapping configuration
Mapping defines what data to extract from DHIS2 and how it is structured for analysis. It is the core step in the Data Extractor workflow in that it fetches indicators of interest, maps them to the corresponding DHIS2 data sources, and standardizes outputs for DataSuite apps and other analyses.
DHIS2 data mapping workflow
Navigating the CD2030 DHIS2 Data Extractor
Once successfully logged in, the following views help in navigating the CD2030 DHIS2 Data Extractor.
Dashboard
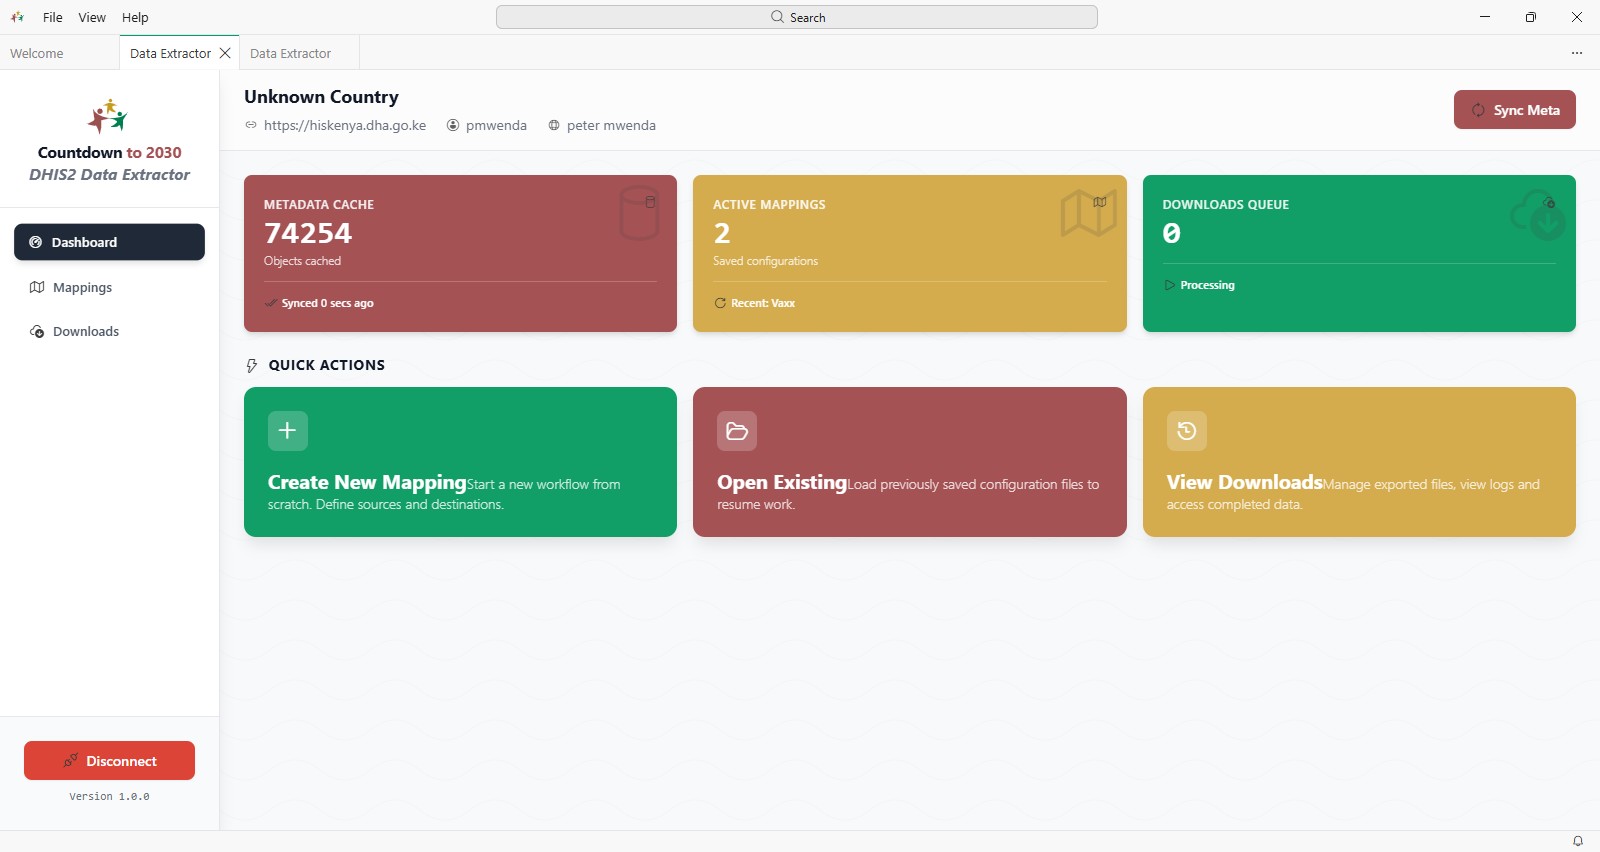 Data Extractor dashboard
Mappings Manager
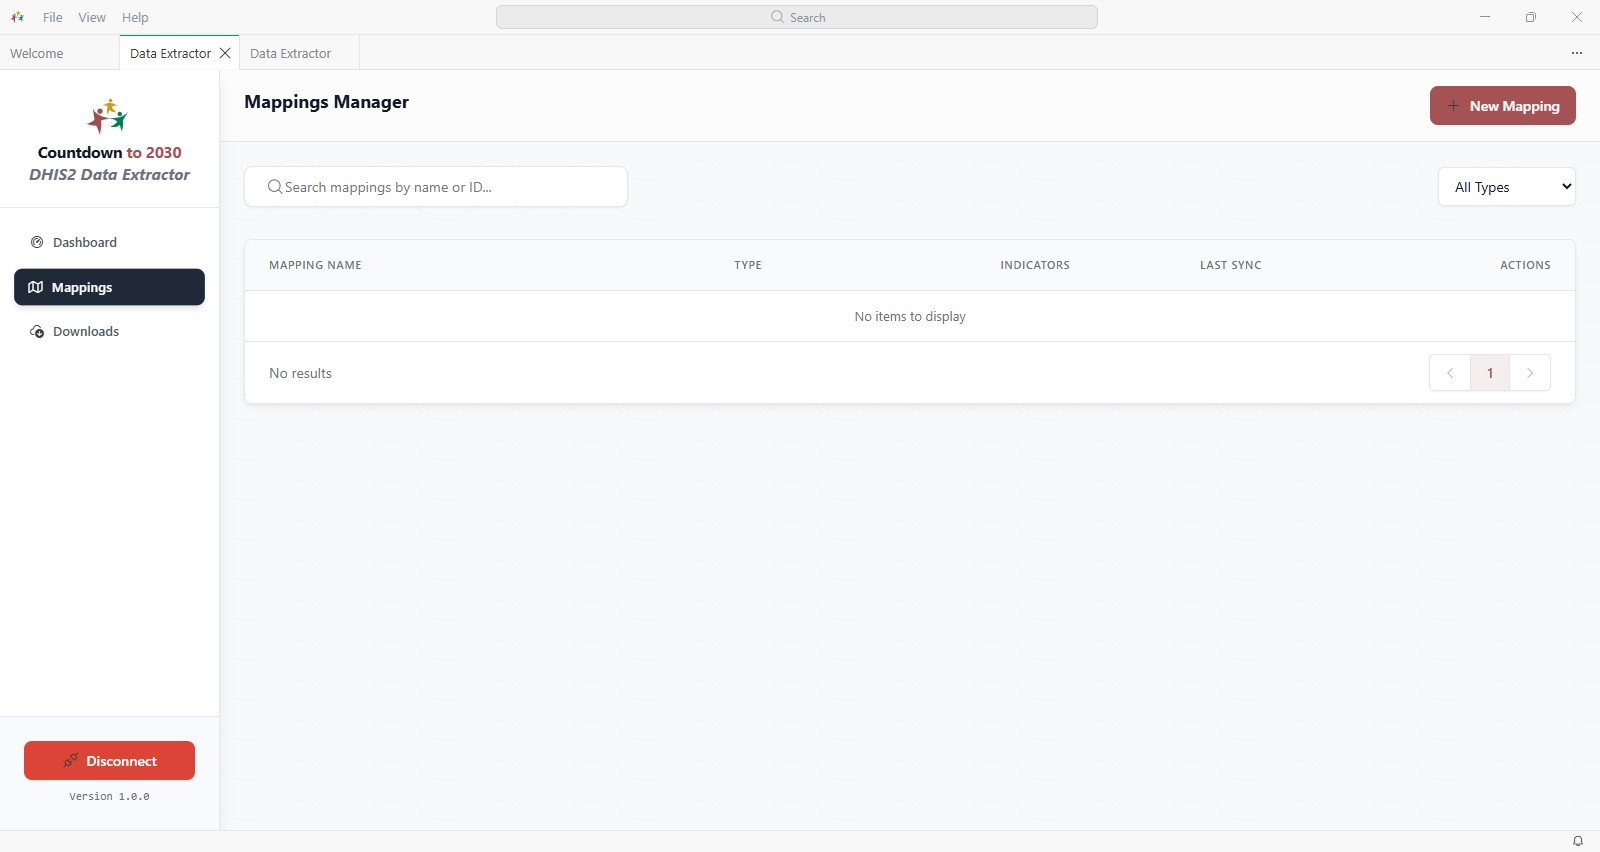 Mappings Manager listing saved mappings
The Mappings Manager is the central place to:
- View all saved mappings
- Search mappings by name or ID
- Create a new mapping
Key actions
- New Mapping: start a new configuration
- Search bar: locate existing mappings
- Actions column: edit, download, clone, or delete the selected mapping
Downloads Manager
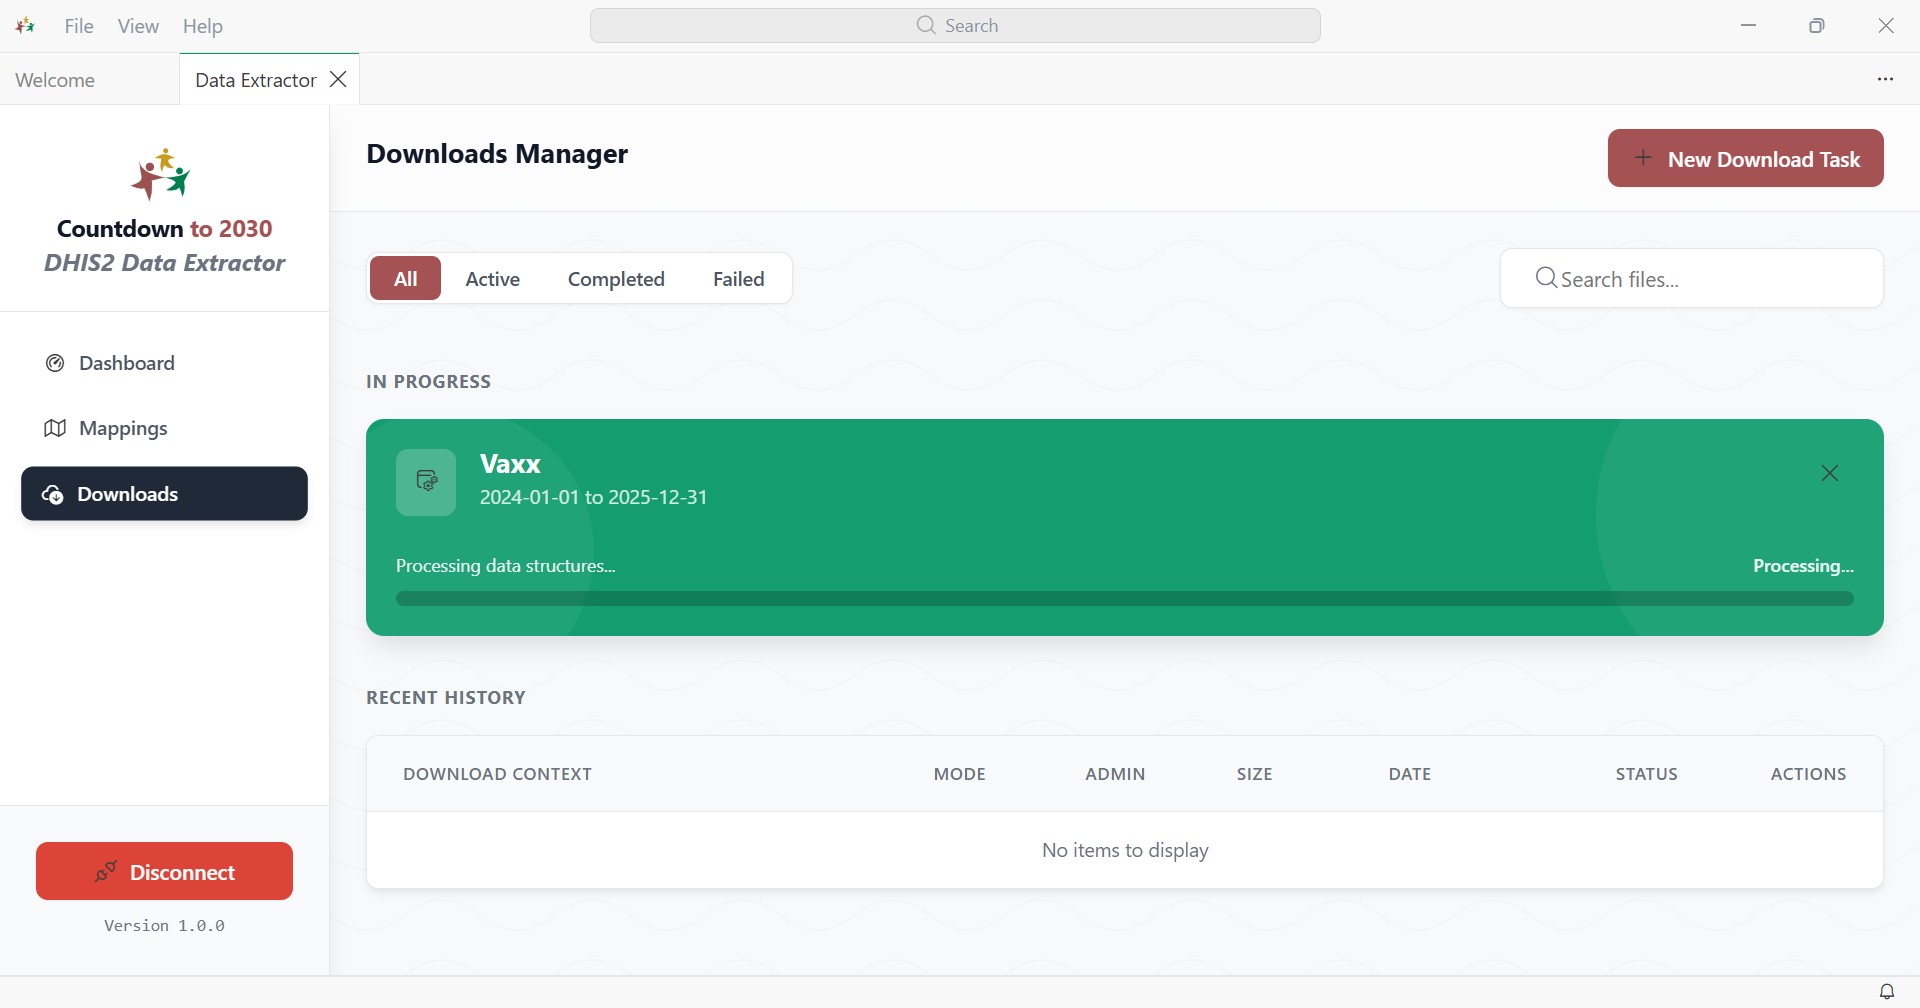 Downloads Manager showing a download in progress
The Downloads Manager is where you create download tasks and follow their progress (see downloading data).
Creating a new mapping
Click New Mapping
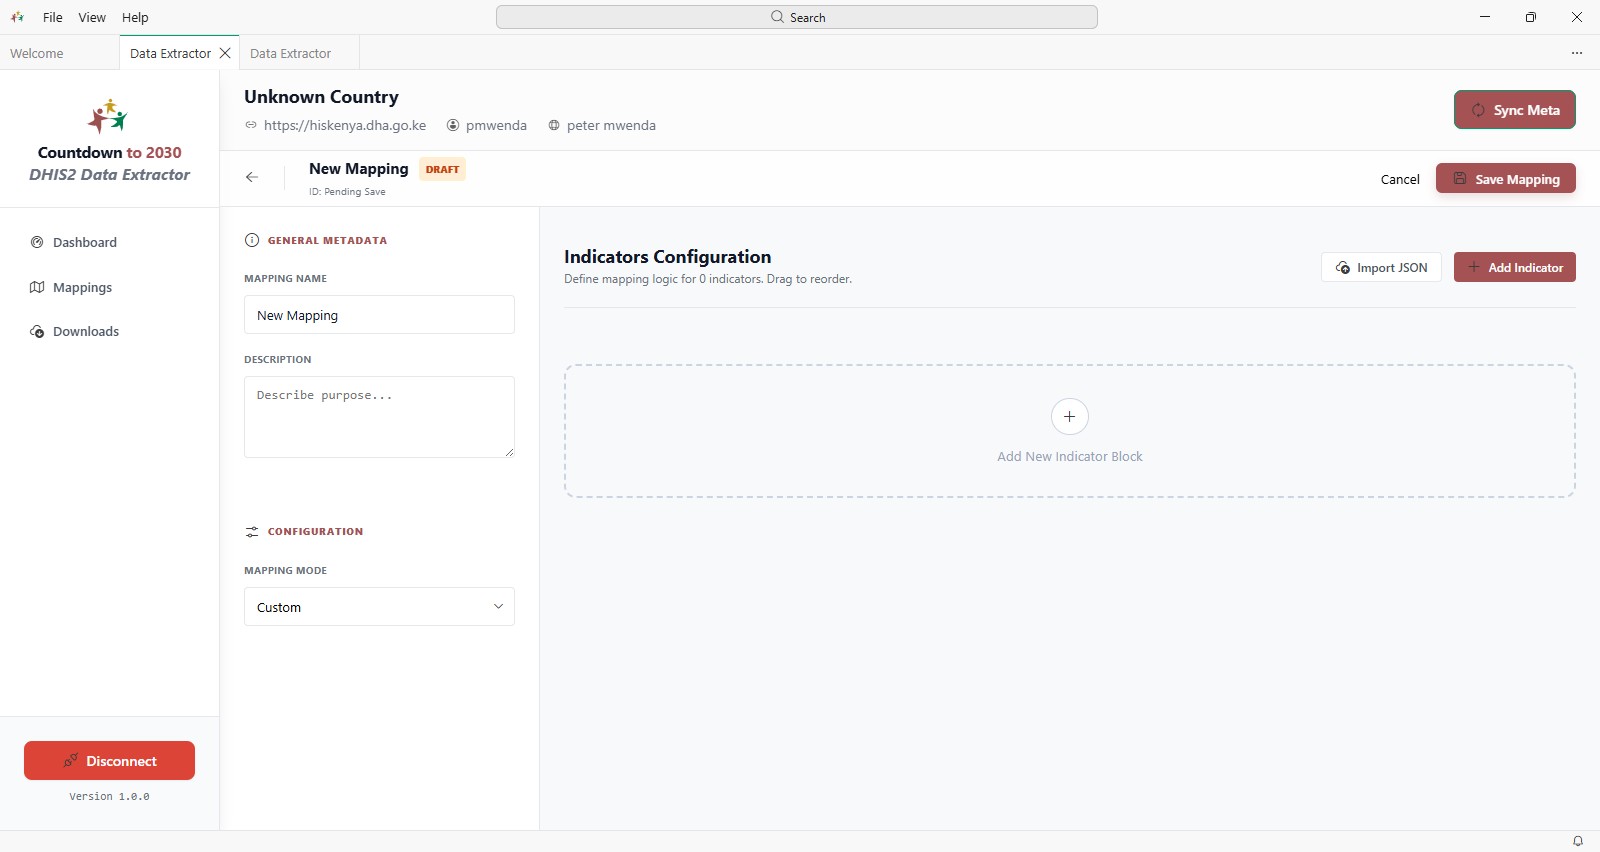 New mapping screen in draft mode
Configure the mapping
Define the mapping name, description, and mapping mode.
Important: Use a clear naming convention. For example:
- Mapping name:
CAM2026_CountryName - Description:
MNH Indicators for CAM 2026 Workshop
Select the mapping mode
Choose Countdown or Custom in the Mapping Mode field. Both modes are described below.
Mapping modes
Mapping is the stage where DHIS2 source metadata is linked to the structure needed for downstream analysis. The extractor supports two mapping approaches depending on the use case.
Countdown option
The Countdown option maps indicators and related metadata to the Countdown harmonized MNCH data template. This is the preferred approach when teams are preparing data for Countdown to 2030 workflows and want a standardized structure that aligns with the embedded resource template used by the application.
This option is useful when:
- the analysis is focused on harmonized MNCH indicators,
- teams want consistency across countries or time periods,
- outputs are intended for Countdown-aligned analytical workflows.
Recommended for standardization: Use the Countdown option when your goal is to produce data aligned with the harmonized MNCH template embedded in the extractor resources.
Custom option
The Custom option allows users to create mappings for other programs or use cases that do not fit the Countdown harmonized template. This gives teams flexibility to work with country-specific program structures, additional service areas, or bespoke indicator sets.
This option is useful when:
- the program area goes beyond the Countdown MNCH scope,
- users need a country-defined mapping structure,
- the extraction supports another analytical workflow outside the standard harmonized template.
Flexible mapping: Choose the Custom option when you need to prepare data for other health programs, local reporting needs, or non-Countdown analytical pipelines.
Mapping summary
There are currently two mapping modes:
- Countdown: this mode has a predefined list of MNCH indicators and structure, as in the harmonized data template.
- Custom: fully user-defined configuration, where the user can download any data that they have access rights to.
Changing the mapping mode midway will reset your progress if the mapping is not saved. Always save your mapping before switching mapping modes.
Indicators configuration
The Indicators Configuration panel is where the indicators of a mapping are defined. Each indicator block has an Internal Name and a Target Export Code, and is linked to the DHIS2 data elements, indicators, or datasets that feed it (Source Configuration). Click Save Mapping to store your changes.
In Countdown mode, the indicators follow the harmonized MNCH template and are marked COUNTDOWN. Search and add the DHIS2 sources for each indicator.
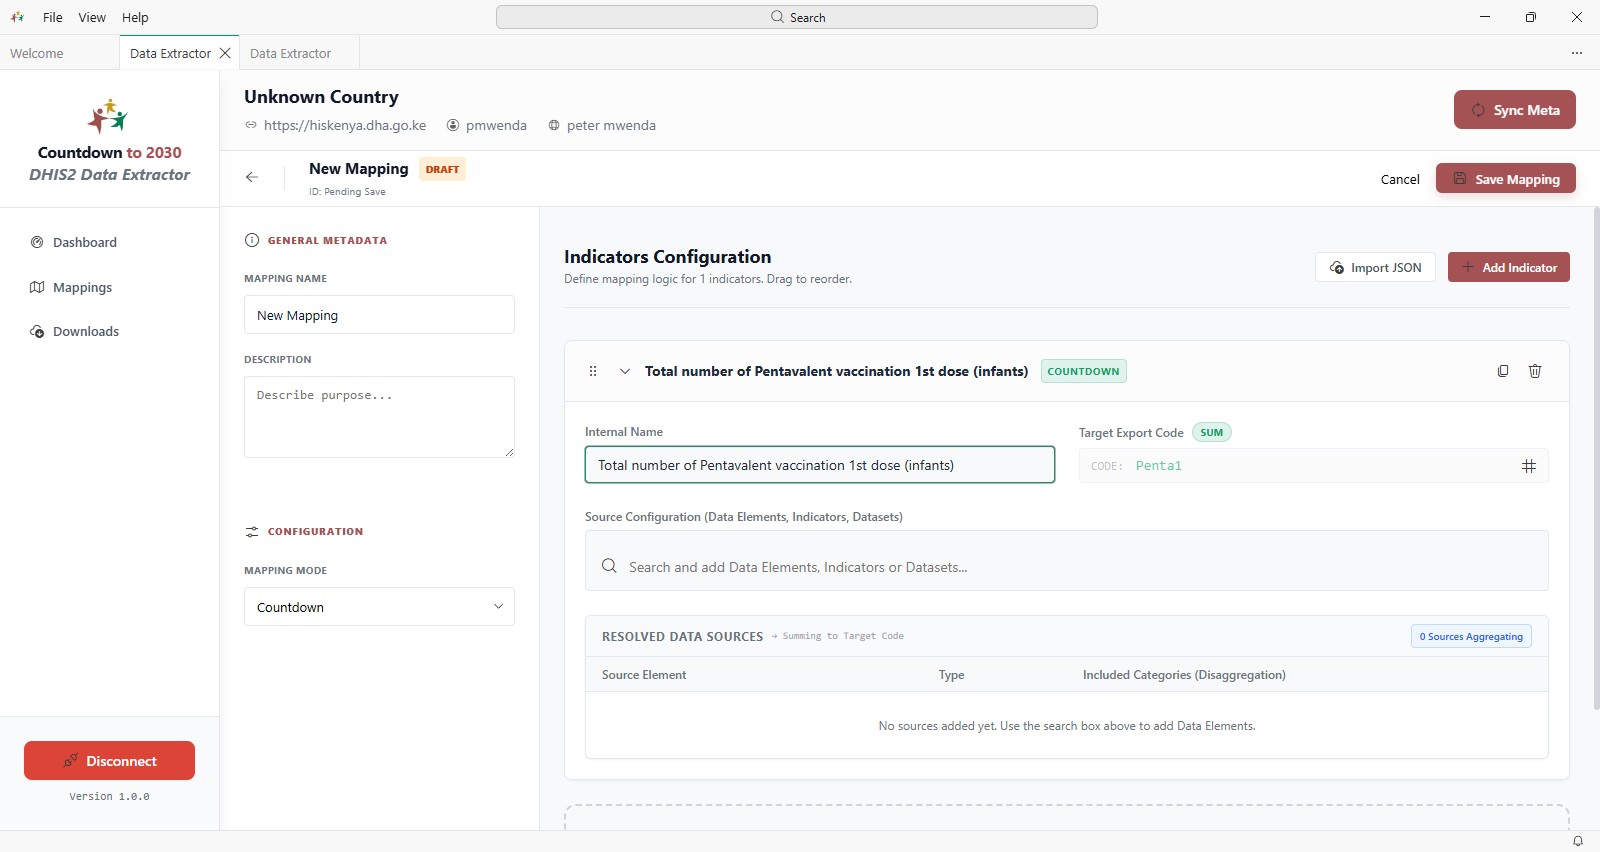 Indicators Configuration in Countdown mode
In Custom mode, you define the indicators yourself, add the DHIS2 sources, and choose which category option combinations (disaggregations) to include.
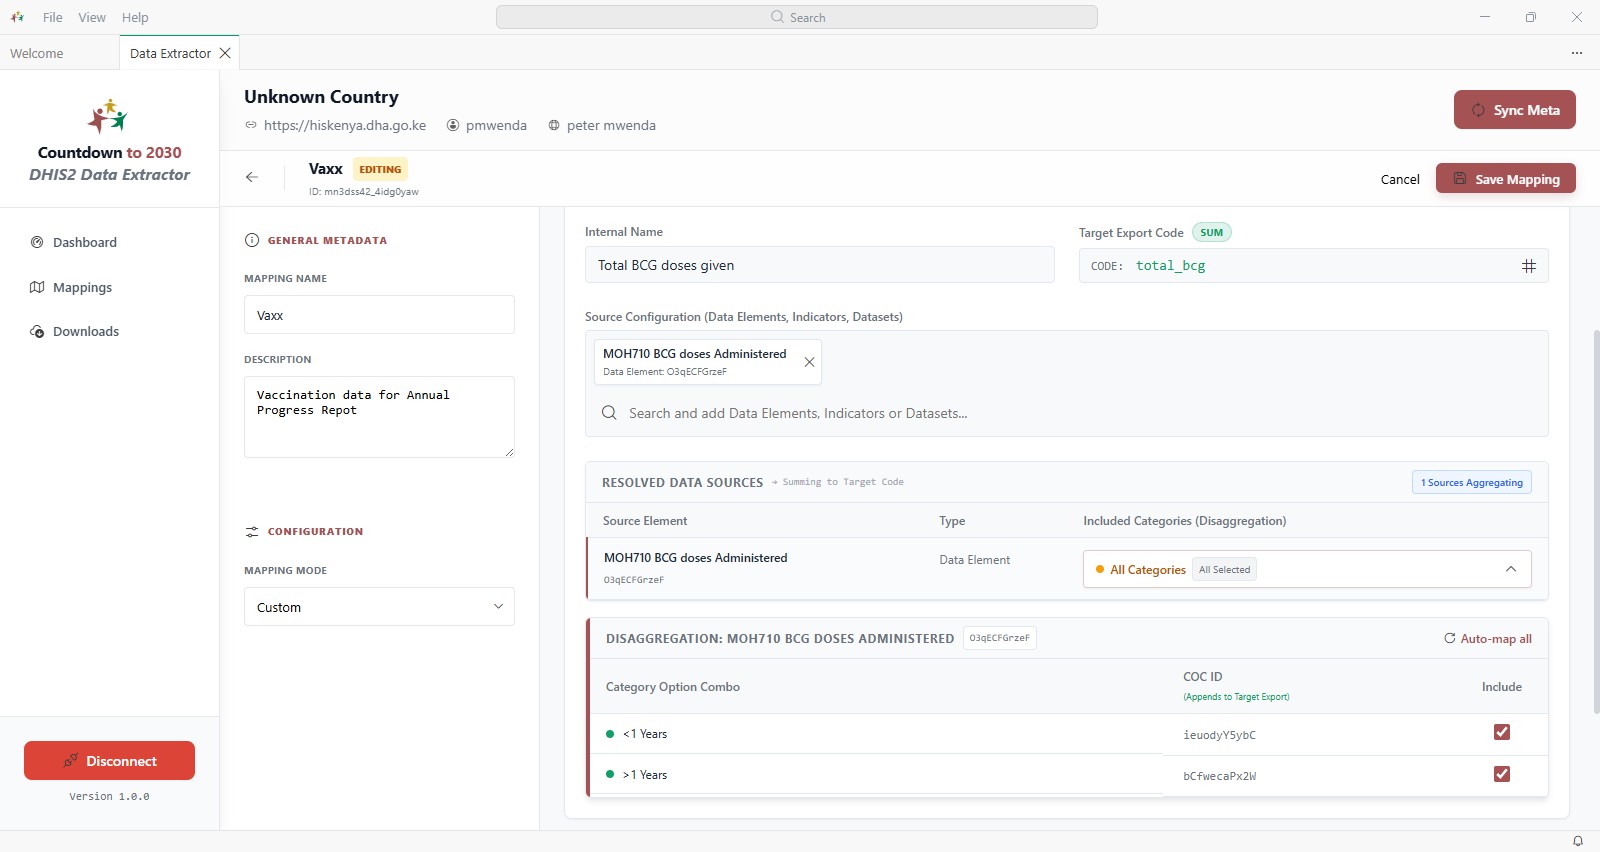 Indicators Configuration in Custom mode with a data element source and its disaggregation