Data quality assessment
Overview
High-quality health facility data form the foundation of reliable coverage estimates. This module systematically evaluates health facility data by considering the standard data quality metrics, which include:
- Reporting completeness
- Outlier detection
- Internal consistency
- Data missingness
- Ratio calculations
- Overall quality score
DQA metrics in the CD2030 analytical approach
Reporting completeness
For further reading on the scientific basis and methods used to assess reporting completeness, go to Reporting completeness: rationale.
| Metric | Numerator | Denominator | Interpretation |
|---|---|---|---|
| 1a | Number of monthly facility reports received | Total expected reports (12 × number of facilities) | ≥90% is good; affects trend interpretation |
| 1b | Districts with ≥90% reporting completeness | Total districts | Identifies low-performing districts |
| 1c | Districts with no missing values across all forms | Total districts | Identifies the distribution of missing values across districts |
Statistics for 1a and 1b are based on the mean of four reporting forms (ANC, delivery, immunization, OPD).
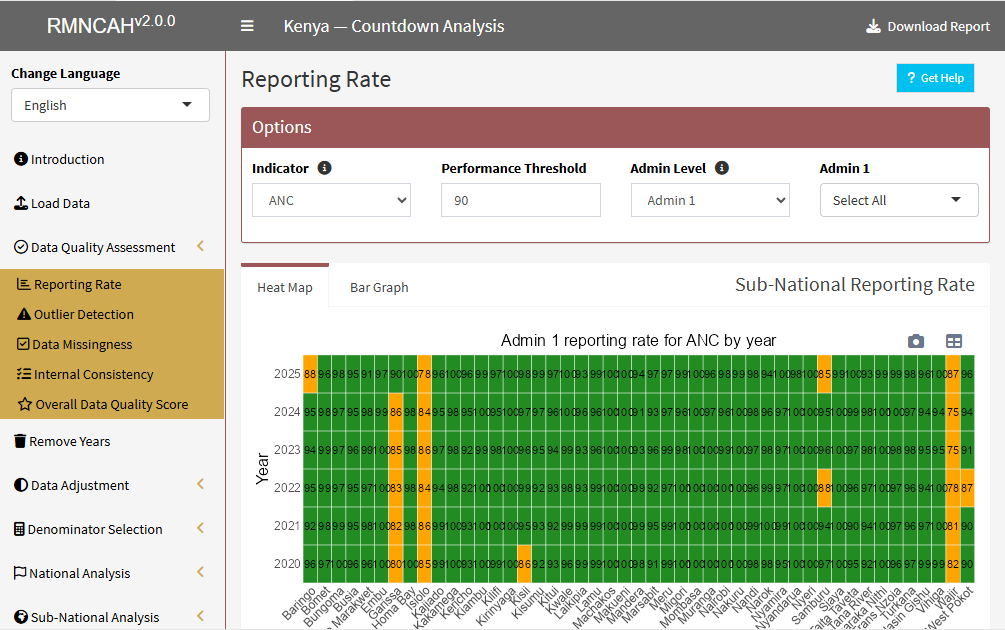 Sub-national reporting rate heat map
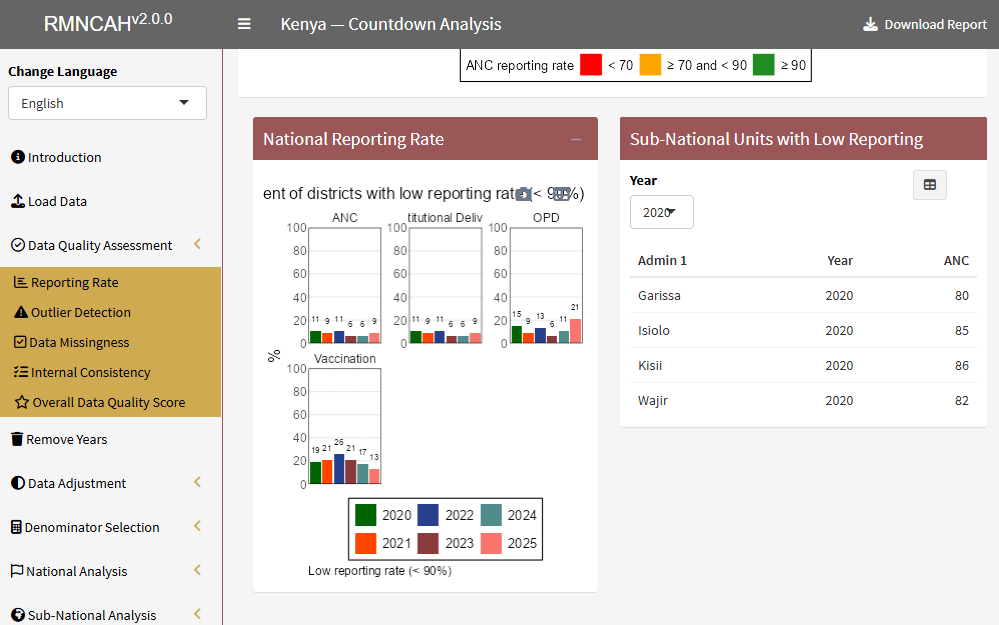 National reporting rate and sub-national units with low reporting
Outlier detection
An extreme outlier is defined as a monthly value that is 5 times the median absolute deviation (MAD) from the monthly median value for a particular year. For further reading on the scientific basis and methods used to assess and adjust for extreme outliers, go to Extreme outliers: rationale.
| Metric | Numerator | Denominator | Interpretation |
|---|---|---|---|
| 2a | Monthly values not classified as outliers | Total monthly values | ≥99% expected |
| 2b | Districts with no outliers | Total districts | ≥90% expected |
Outliers are identified statistically. Always assess whether deviations reflect real-world events (e.g., campaigns) or data errors.
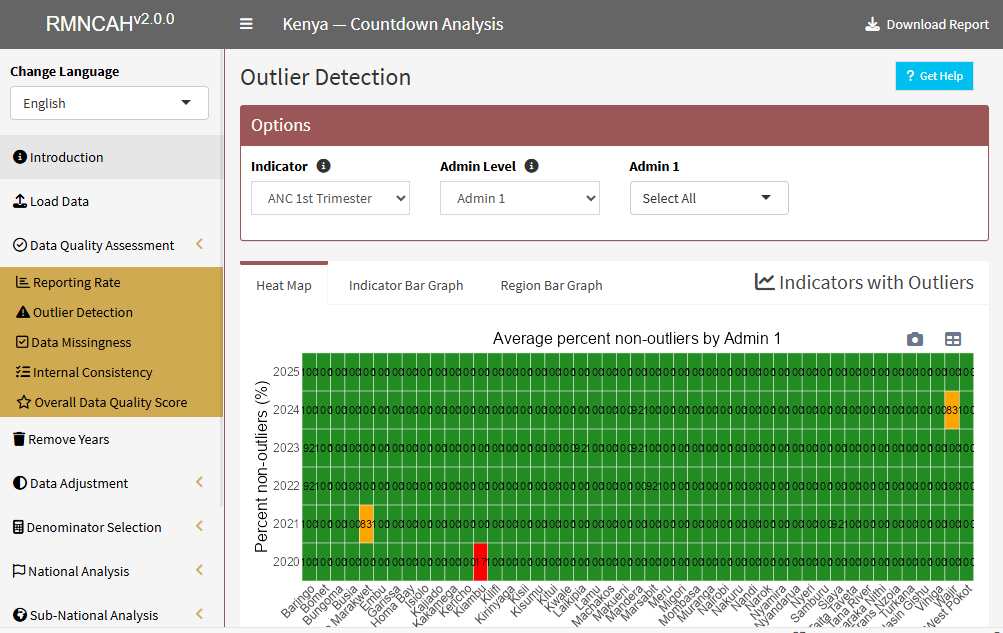 Outlier detection heat map by region and year
Internal consistency
- Internal consistency assesses the degree to which related indicators are aligned within the dataset, based on expected epidemiological and service delivery relationships.
- Within the CD2030 analytical framework, this step complements other DQA metrics by evaluating whether indicators that are biologically or programmatically linked follow plausible patterns.
- Unlike standalone indicator checks, internal consistency focuses on relationships between indicators, ensuring that reported values reflect realistic service delivery pathways across the continuum of care.
The following metrics are considered when assessing internal consistency:
| Metric | Numerator | Denominator | Interpretation |
|---|---|---|---|
| 3a | ANC1 reported | Penta1 reported | Expected ratio range |
| 3b | Penta1 reported | Penta3 reported | Based on survey data |
| 3c | Districts within expected ratio | Total districts | Wider acceptable range |
| 3d | Districts within expected range | Total districts | Same as above |
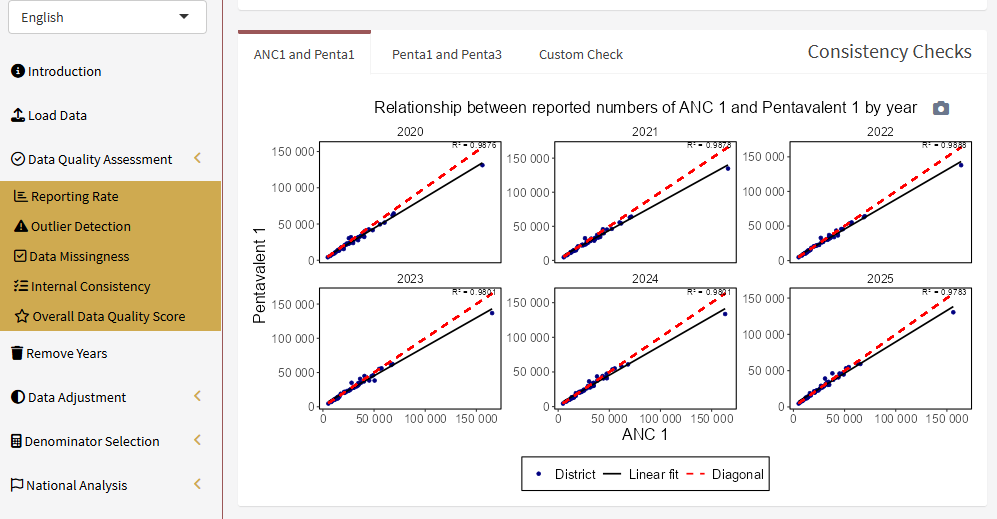 Consistency checks between ANC1 and Penta1 by year
Data missingness
- TBC
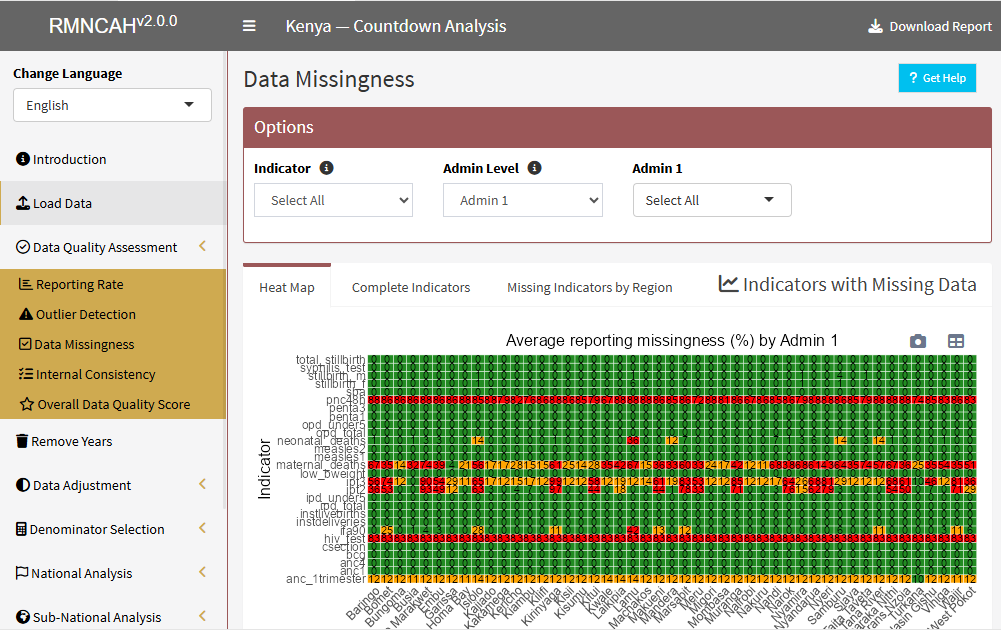 Data missingness heat map by indicator and region
Ratio calculations
- TBC
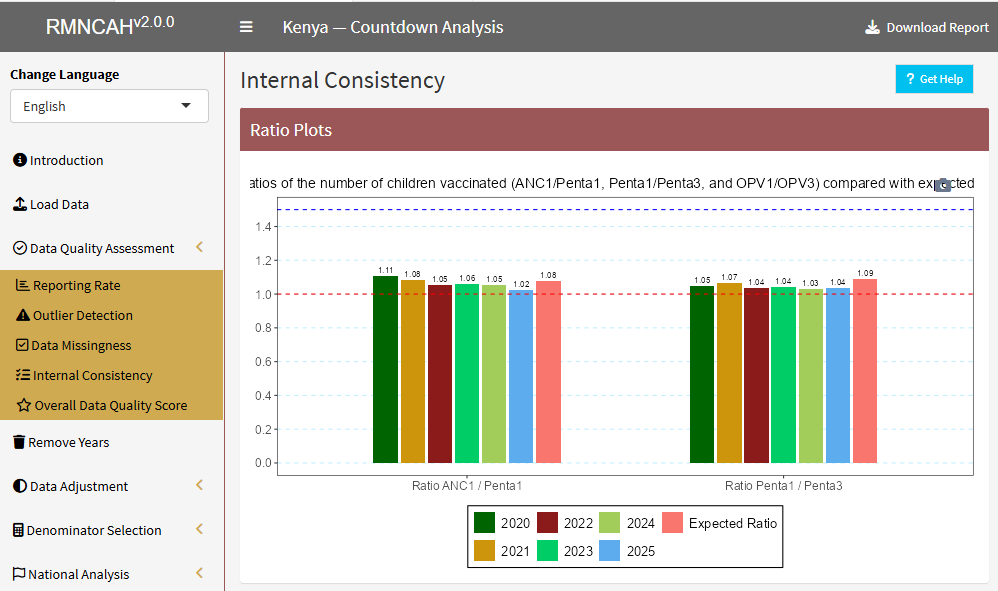 Ratio plots of ANC1/Penta1 and Penta1/Penta3 by year
Overall quality score
| Metric | Numerator | Denominator | Interpretation |
|---|---|---|---|
| Overall score | Computed automatically | Computed automatically | Mean of indicators 1a, 1b, 2a, 2b, 3c, 3d |
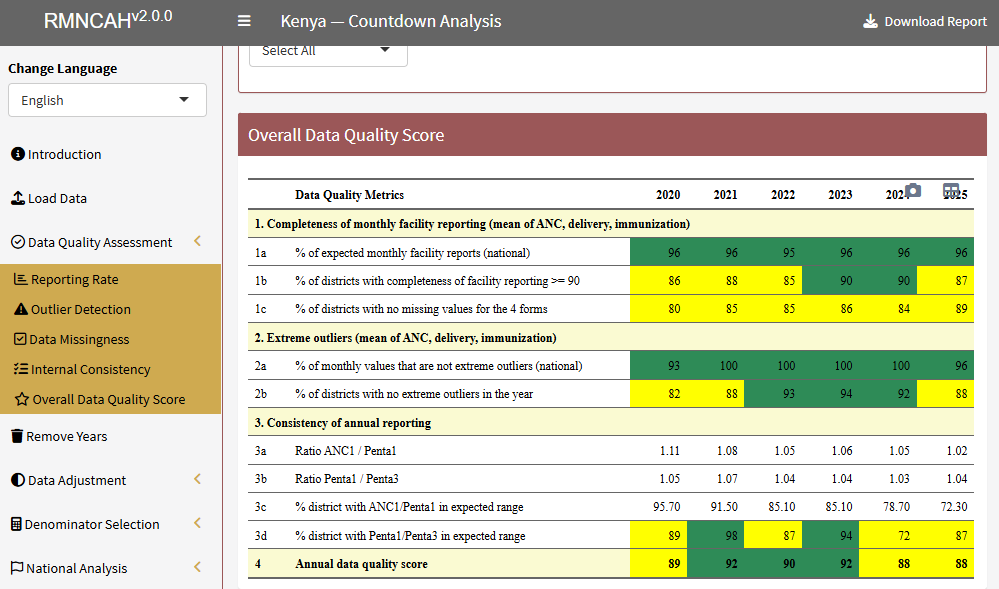 Overall data quality score table by year
DataSuite automatically computes the overall data quality score.